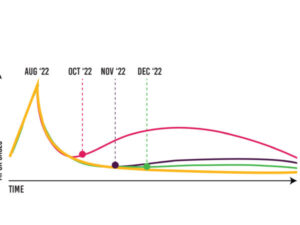
Infographic

Infographic 2020 COVID-19 Organizational Health Survey May 19, 2020 In May 2020, the California HIV/AIDS Policy Research Centers conducted an online survey to document the direct impact of COVID-19 on healthcare and social services providers working to address HIV, Hepatitis C (HCV) and sexually transmitted disease (STDs). Survey respondents included 70 organizations that submitted complete […]

Read More
Infographic
2020 COVID-19 Organizational Health Survey

May 19, 2020

Infographic HIV and Syphilis: Rising Rates for Men Who Have Sex with Men April 9, 2018 After years of decline, sexually transmitted infections are increasing at alarming rates. The national rate of reported primary and secondary syphilis was over four times greater in 2016 than it had been in 2000. Syphilis cases increased by 18% […]

Read More
Infographic
HIV and Syphilis: Rising Rates for Men Who Have Sex with Men

April 9, 2018

Infographic Navigating Behavioral Healthcare for Low-Income Californians Living with HIV April 14, 2017 This diagram illustrates the pathways that a low-income person living with HIV and in need of behavioral health services might follow through the healthcare system in California. Based on interviews with key informants and service providers in 2015-2016, the figure highlights how […]

Read More
Infographic
Navigating Behavioral Healthcare for Low-Income Californians Living with HIV

April 14, 2017