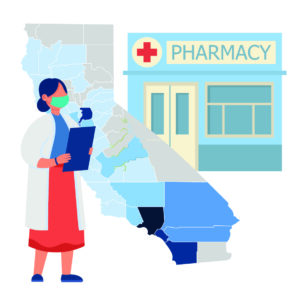
Category: Infographic

Infographic Addressing MPOX Disparities Among MSM in Los Angeles County May 15, 2022 In response to the 2022 mpox (monkeypox) outbreak, collaborators from the Southern California HIV/AIDS Policy Research Center and the University of Southern California  adapted a validated microsimulation model to understand the dynamics of mpox disease transmission. Results estimate the impact of vaccination, treatment, …

Addressing MPOX Disparities Among MSM in Los Angeles County Read More »

Read More
Infographic
Addressing MPOX Disparities Among MSM in Los Angeles County

May 15, 2022

Infographic Potential Impact and Equitable Reach of Senate Bill 306 (SB 306), STD Coverage and Care Act May 10, 2022 In 2022, California became the first state to require healthcare plans to cover the costs of home test kits for sexually transmitted diseases (STD) including HIV. Home test kits are provided through a prescription or …

Potential Impact and Equitable Reach of Senate Bill 306 (SB 306), STD Coverage and Care Act Read More »

Read More
Infographic
Potential Impact and Equitable Reach of Senate Bill 306 (SB 306), STD Coverage and Care Act

May 10, 2022

Infographic Equity Considerations for Expanding PrEP Use for MSM in Los Angeles County February 22, 2021 Los Angeles County is one of the 8 priority counties in California under the federal Ending the HIV Epidemic Plan. Despite longstanding efforts, disparities in HIV burden persist, especially among racial/ethnic minority MSM. PrEP is a key pillar of …

Equity Considerations for Expanding PrEP Use for MSM in Los Angeles County Read More »

Read More
Infographic
Equity Considerations for Expanding PrEP Use for MSM in Los Angeles County

February 22, 2021

Infographic 2020 COVID-19 Organizational Health Survey May 19, 2020 In May 2020, the California HIV/AIDS Policy Research Centers conducted an online survey to document the direct impact of COVID-19 on healthcare and social services providers working to address HIV, Hepatitis C (HCV) and sexually transmitted disease (STDs). Survey respondents included 70 organizations that submitted complete …

2020 COVID-19 Organizational Health Survey Read More »

Read More
Infographic
2020 COVID-19 Organizational Health Survey

May 19, 2020

Infographic HIV and Syphilis: Rising Rates for Men Who Have Sex with Men April 9, 2018 After years of decline, sexually transmitted infections are increasing at alarming rates. The national rate of reported primary and secondary syphilis was over four times greater in 2016 than it had been in 2000. Syphilis cases increased by 18% …

HIV and Syphilis: Rising Rates for Men Who Have Sex with Men Read More »

Read More
Infographic
HIV and Syphilis: Rising Rates for Men Who Have Sex with Men

April 9, 2018

Infographic Navigating Behavioral Healthcare for Low-Income Californians Living with HIV April 14, 2017 This diagram illustrates the pathways that a low-income person living with HIV and in need of behavioral health services might follow through the healthcare system in California. Based on interviews with key informants and service providers in 2015-2016, the figure highlights how …

Navigating Behavioral Healthcare for Low-Income Californians Living with HIV Read More »

Read More
Infographic
Navigating Behavioral Healthcare for Low-Income Californians Living with HIV

April 14, 2017